1: Refineries
The black circles displayed on this map are Washington facilities regulated by the Washington State Department of Ecology's
Spills Program. These circles represent fixed shore-side facilities such as refineries and refueling terminals. This includes
facilities that transfer crude oil and petroleum products to or from tank vessels and pipelines. These facilities
refine products such as Gas, Diesel, Crude Oil, Motor Oil, Edible Oils, and more.
Oil pipelines transport crude oils and natural gas from several of these refineries to other cities, states, and countries. If a
spill were to occur at one of these sites or during the transportation process
there could be severe effects on the following.
- Populated residential areas and vulnerable communities.
- Waterways that host culturally significant species and habitat.
- Wetlands and other natural ecosystems.
Click on the points to display more information.
This map includes refinery facilities data.
Please refresh the page if map layers are not showing.
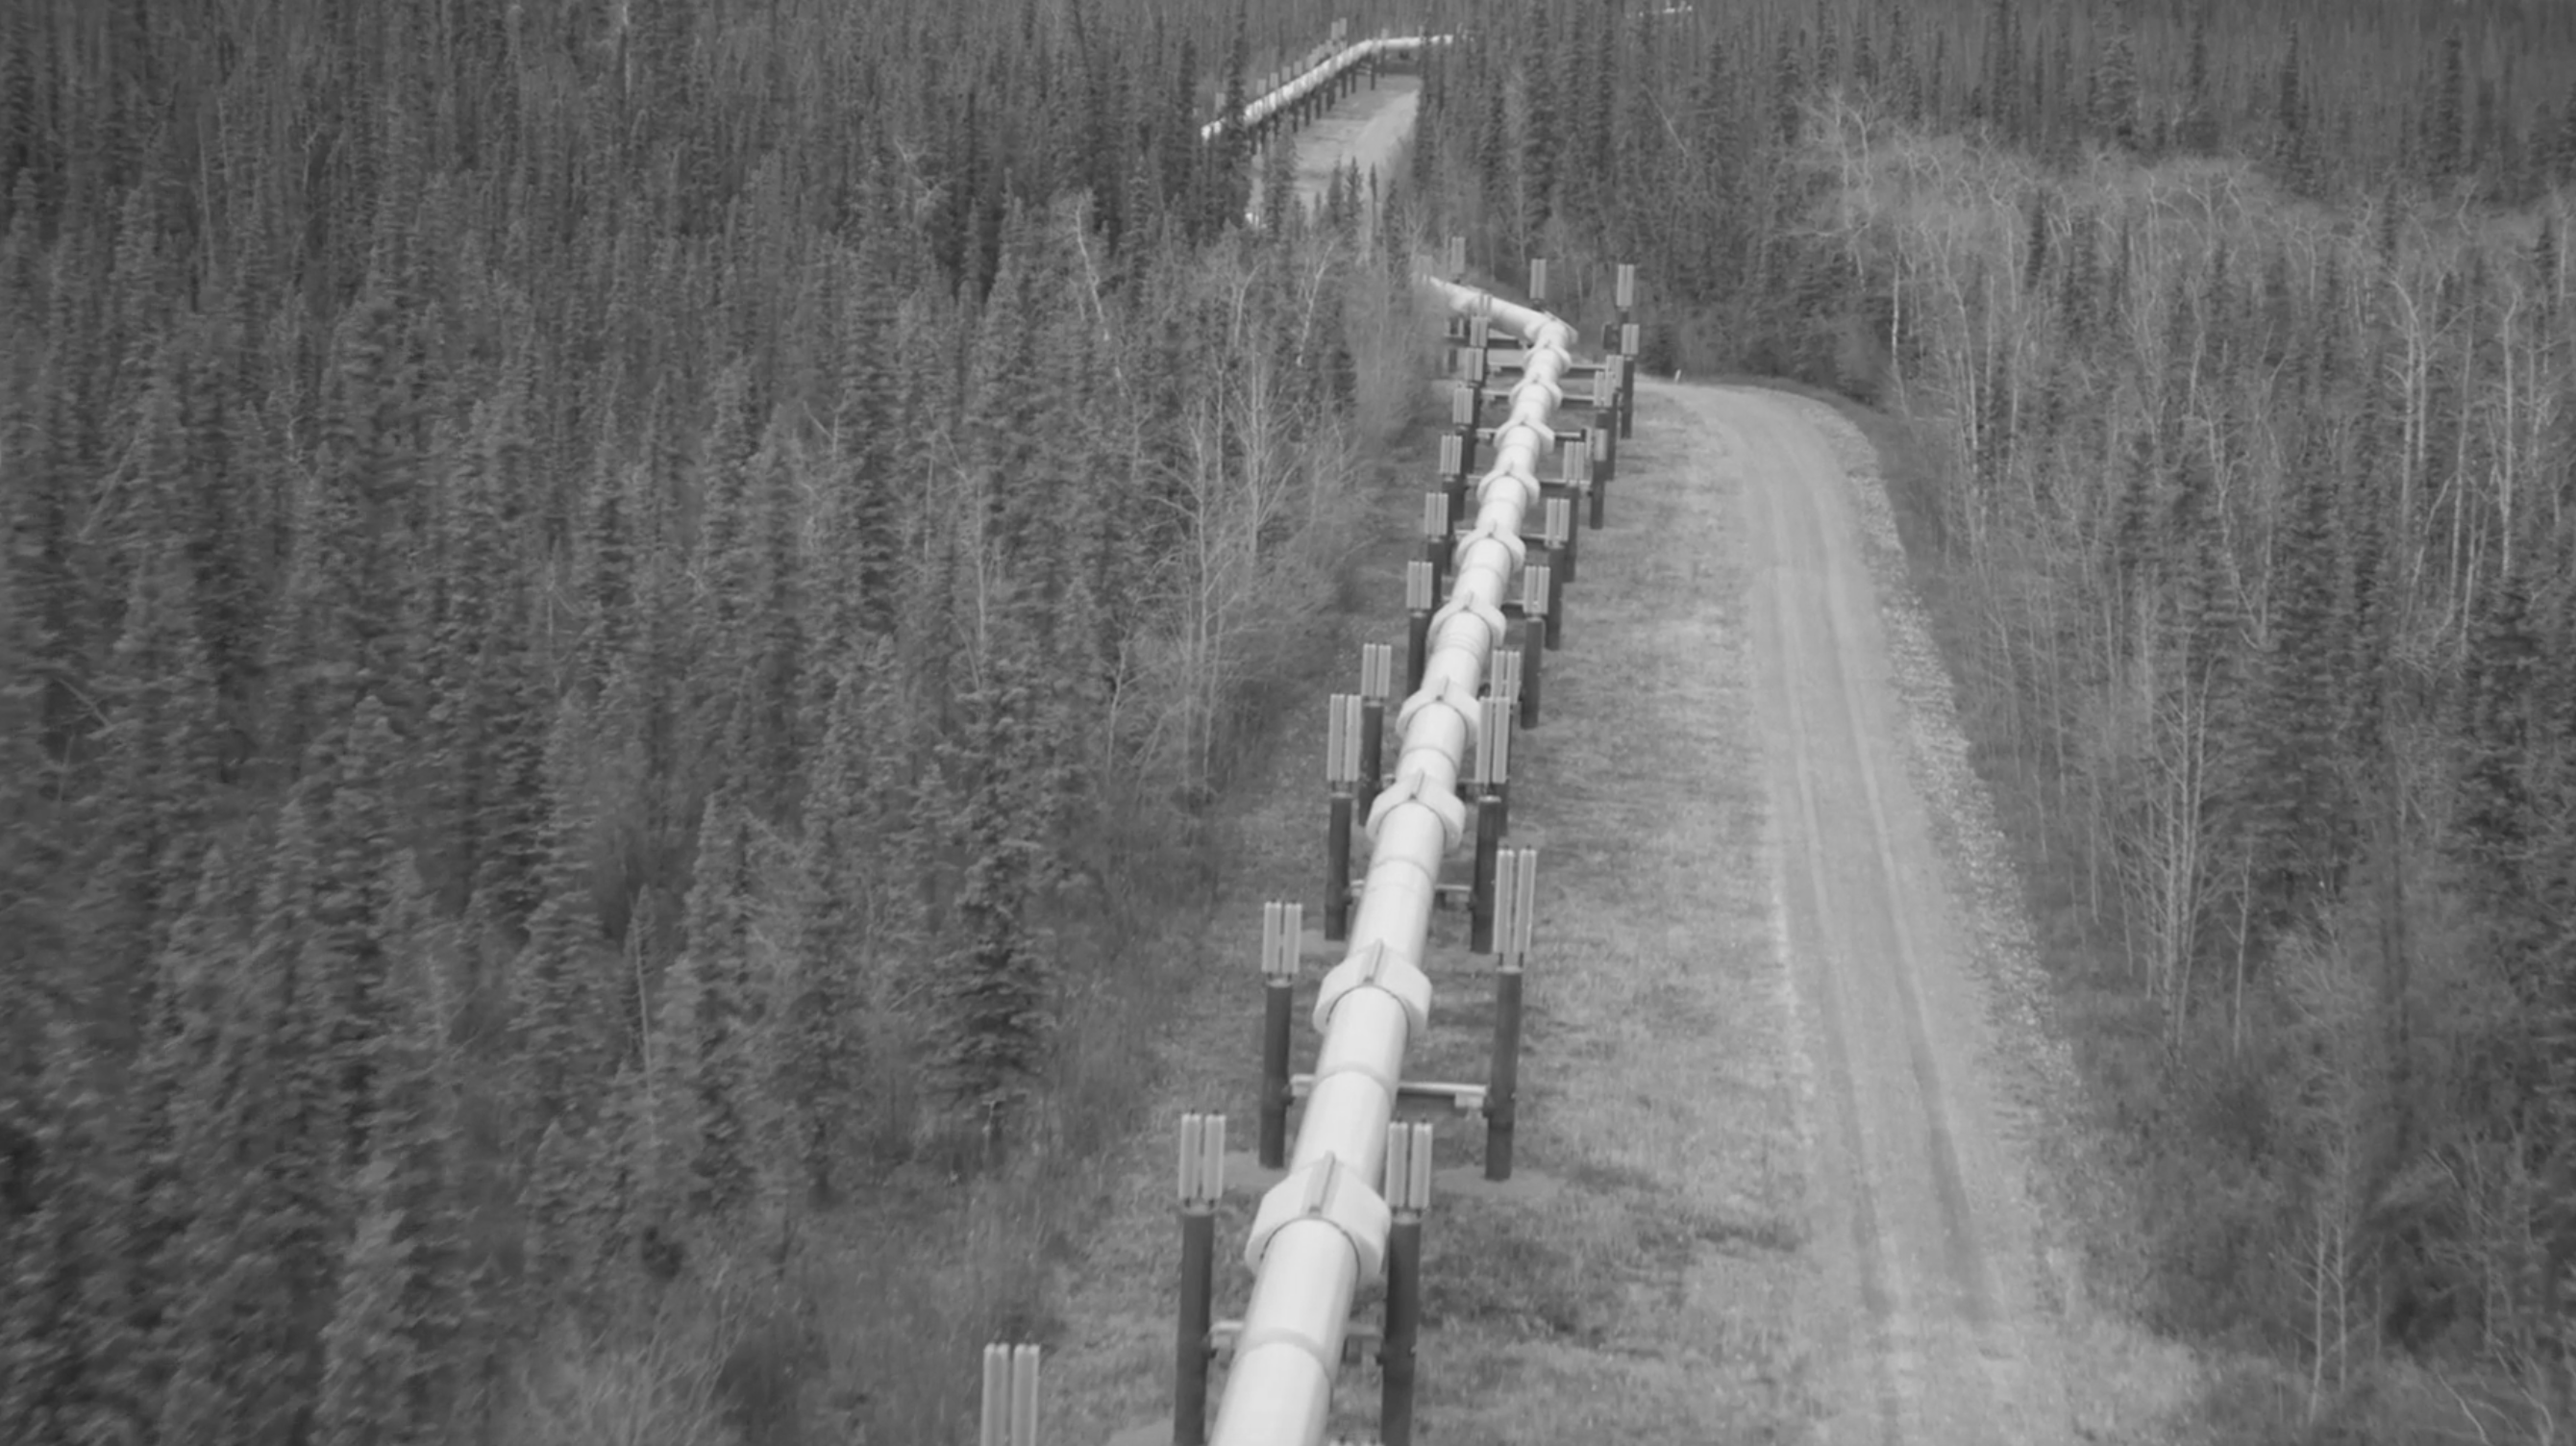
2: Western WA Pipelines
Olympic Pipeline:
- "The Olympic Pipeline is a 400-mile interstate pipeline system that includes 12-inch, 14-inch, 16-inch, and 20-inch diameter pipelines"
(BP).
- "The pipeline runs along a 299-mile corridor from Blaine, Washington to Portland, Oregon" (BP).
- "The system transports gasoline, diesel, and jet fuel" (BP).
Trans Mountain Pipeline:
- "The Trans Mountain Puget Sound Pipeline is a 111-kilometre (69-mile) pipeline system made up of 16- to 20-inch pipe" (TransMountain).
- This system "...has been shipping Canadian crude oil products since 1954 to Washington state.." (TransMountain).
- This system has "..the capacity for up to about 240,000 bpd (28,600 m3 per day) depending on petroleum types..." (TransMountain).
This map displays the Olympic and Trans Mountain pipelines along with the refineries they are connected to. Click on the features to display information.
This map includes refinery data,
Olymipic pipeline image,
Trans Mountain data, and
information on the refineries the Trans Mountain Pipeline connects to.
3: Western WA Wetlands
Wetlands are an important environmental asset to Washington State. "Wetlands are among the most productive ecosystems in the
world, comparable to rain forests and coral reefs" (EPA).
This map displays all the wetlands in Washington that are within a half mile radius of these pipelines. If a spill were to occur, these
are the wetlands that are at the highest risk of exposure to an oil spill.
Olympic Pipeline:
The Olympic Pipeline runs south from Bellingham to Vancouver Washington and is within a half mile radius of 1,671 wetland areas
encompassing 21,761 square miles of wetland area.
Trans Mountain Pipeline:
The Trans Mountain Pipeline runs into Bellingham Washington from Canada and is within a half mile radius of 502 wetland areas encompassing
3,607 square miles of wetland area.
This map includes wetlands data.
4: Western WA Low Income Areas
Low-income areas are at a higher risk of living in proximity to petroleum facilities.
Petroleum terminals built in low-income areas contribute to "disproportionate exposure to pollution from
burning fossil fuels and chemicals leaching into the water table" (The Climate Reality Project)..
- "Oil refineries are a major source of air pollutants, including toxic metals, particulates, and many types of gasses" (Ucar).
- These communities are subjected to spill risk during the transfer between vessel, refinery, and pipeline.
- These refineries and its pollutants directly affect the health of these communities and their environment.
This map contains Washington low
income data represented by the blue areas and black points that represent Washington petroleum refineries that
connect to both the Olympic pipeline and Trans Mountain pipeline.
Click the points to display refinery information and the blue areas to display the population percent that is considered low-income.
5: Western WA Tribal Lands
In Washington State, there is an inequality in the location of petroleum refineries and their corresponding pipelines.
Black points on this map display refineries, each of which provides oil to the Olympic and Trans Mountain pipeline. The green areas
show tribal lands. The location of these refineries are located beside two of Washington's tribal lands. Spills
in these locations can have detrimental effects on shorelines surrounding these areas.
This map displays tribal land proximity to refineries. Both tribal lands found here, Lummi and Swinomish, have experienced the effects of
oil spills.
Click the points and areas to display refinery information and the green areas to display the names of these tribal lands.
This map includes tribal lands data.
6: Eastern WA Pipeline
Northwest Pipeline:
- This is a 1,377-mile pipeline system (TC Energy).
- This system has transported natural gas since 1962 (TC Energy).
- This system also transports oil from western Canada into Idaho, Washington, Oregon, and California.
Yellowstone & Chevron Pipeline:
- The Chevron Pipeline is part of a 3,000 mile network that carries 1.5 million barrels of oil equivalent, chemicals, and refined products
every day (Chevron).
- The Chevron has a storage capacity of ~2.6 million barrels of product (Chevron).
- The Yellowstone Pipeline is a~709 mile long pipeline operated by Phillips 66 (Yellowstone).
- The Yellowstone Pipeline has a maximum diameter of 10 inches that transports fossil fuels from Montana to Washington (Yellowstone).
This map displays the Northwest Pipeline, the Chevron Pipeline, and the Yellowstone Pipeline along with the refineries they are connected to. Click on the points to display additional information. The Chevron and Yellowstone
pipleine is based on this map.
7: Eastern WA Wetlands
Wetlands are an important environmental asset to Washington State. "Wetlands are among the most productive ecosystems in the
world, comparable to rain forests and coral reefs" (EPA).
This map displays all the wetlands in Washington that are within a half mile radius of these pieplines. If a spill were to occur, these
are the wetlands that are at the highest risk of exposure to an oil spill.
Northwest Pipeline:
The Northwest Pipeline, running from Spokane south through Eastern Washington, is within a half mile radius of 89 wetland areas
encompassing ~1,176 square miles of wetland area.
Yellowstone & Chevron Pipelines:
Combined, the Yellowstone & Chevron Pipelines in Eastern Washington are within a half mile radius of 598 wetland areas encompassing
~5,820 square miles of wetland area.
This map includes wetlands data.
8: Eastern WA Low Income Areas
Low-income areas are at a higher risk of living in proximity to petroleum facilities.
Petroleum terminals built in low-income areas contribute to "disproportionate exposure to pollution from
burning fossil fuels and chemicals leaching into the water table" (The Climate Reality Project)..
- "Oil refineries are a major source of air pollutants, including toxic metals, particulates, and many types of gasses" (Ucar).
- These communities are subjected to spill risk during the transfer between vessel, refinery, and pipelines.
- These refineries and their pollutants directly affect the health of these communities and their environment.
This map contains Washington low
income data represented by the blue areas and black points that represent Washington refineries that
connect to both the Chevron and Yellowstone pipelines.
Click the black points to display refinery information and the blue areas to display the population percent that is considered low-income.
9: Northwest Pipeline Expansion
On October 19th, 2023, the Federal Energy Regulatory Commission (FERC) allowed the proposed gas transmission Northwest Pipeline
to move forward with its expansion. This expansion will “…upgrade three existing compressor stations on the Gas Transmission
Northwest (GTN) system..." (TC Energy). This project will allow for the pipeline to
transport 150,000 dekatherms of natural gas a day, enough gas to power 750,000 homes. This pipeline will continue
at this rate for 50 years after its completion (Washington Governor Jay Inslee).
- Gov. Jay Inslee stated that hundreds of millions of dollars have been invested to achieve 100% clean electricity by 2045 (Inslee, Jay).
- If implemented, the GTN pipeline “...would represent 48 percent of the region’s target greenhouse gas emissions from all sources" (Inslee, Jay).
- If expanded, the GTN pipeline would continue to operate after Washington transitions to net zero emissions.
- Due to the decline of gas sales in Washington State, GTN may not be able to recover their invested costs. “Those costs
will increasingly burden the remaining customers and GTN may be unable to recover the costs, resulting in a stranded asset”
(Inslee, Jay).
This map displays all the pump stations for this pipeline along with the three proposed pump stations. The current pump
stations are displayed as black points while the proposed updated pump stations are represented in blue.
NW Pipeline Based On
Compressors Based On
10: Northwest Pipeline Rupture Risk
Not only does this pipeline expansion go against the climate goals and laws of Washington, Oregon, and California, but it introduces
unneeded risk to Washington's communities and environments.
- On April 16th, 2024, a section of TC Energy's NGTL gas pipeline in Alberta burst and
caught on fire. TC Energy is the company expanding the Northwest pipeline. This rupture sparked a forest fire in the remote area (Reuters).
- Similar ruptures in Washington would "...not only harm the environment but also present a heightened wildfire risk in the arid regions it passes
through".
- “An explosion of that level in eastern Washington or eastern Oregon would be catastrophic” (APN News).
This map displays the NorthWest pipeline along with major fire data from 1973 to 2022.
This map contains Washington fire data.
11: Olympic Spill
On December 12th, 2023, the Olympic pipeline ruptured near Washington's Skagit River (AP News).
"About 25,660 gallons (97,100 liters) of gasoline spilled after a small tube leading from the main Olympic Pipeline to a
pressure-check valve failed on Sunday..." (AP News).
"The EPA said responders placed an absorbent boom downstream of the spill in Hill Ditch and Bulson Creek, which support salmon
and other wildlife and which flow into the Skagit River" (AP News).
This map displays the location of the Olympic Pipeline burst on December 12th, 2023.